


How has Brexit affected Scotland’s economy? A November 2025 working paper estimates that Brexit reduced UK GDP by 6% to 8% by 2025. Scotland, as part of the UK economy, sits inside that UK-wide estimate, and its industry mix shapes how the effect shows up.
For the wider picture, see the economic impact of brexit across the UK. Scotland-specific detail on labour supply is covered in how has brexit affected the nhs workforce.
How the damage builds up
Brexit’s economic effect is gradual and cumulative, not a single shock. The authors of the Stanford SIEPR working paper (Bloom, Bunn, Mizen, Smietanka and Thwaites) describe the impact as accumulating over time. They attribute the large negative effects to a combination of four mechanisms.
- Elevated uncertainty. Firms facing unclear future trading terms have reason to delay decisions, which feeds into weaker investment.
- Reduced demand. Weaker demand for what firms sell lowers output and hiring.
- Diverted management time. Managers spend time adapting to new arrangements instead of running and growing the business.
- Increased misallocation of resources. Capital and labour end up in less productive uses than they otherwise would.
These mechanisms matter for Scotland because they apply to any firm, whatever its sector. A Scottish exporter, a food producer and a services business can each be hit through uncertainty and distracted management, even where formal trade barriers differ.
The UK-wide estimates behind the Scottish picture
The study uses almost a decade of data since the referendum. It combines simulations based on macro data with estimates from micro data collected through the Decision Maker Panel firm survey. That pairing makes the figures more than a model projection, because it draws on what businesses report.
| Measure (UK-wide) | Estimated reduction attributed to Brexit | Planning use |
|---|---|---|
| GDP, by 2025 | 6% to 8% | The headline benchmark against which Scottish output estimates should be read. |
| Investment | 12% to 18% | The largest fall, so the strongest signal for capital-heavy Scottish sectors. |
| Employment | 3% to 4% | Useful for judging labour-market claims about Scottish regions and sectors. |
| Productivity | 3% to 4% | Shows that part of the loss is output per worker, not just fewer jobs. |
These figures come from the SIEPR working paper and are UK-wide, not Scotland-only.

What UK-wide figures mean for Scotland
Gross domestic product measures the value of goods and services an economy produces, and the paper’s 6% to 8% reduction is a UK-level result. It should not be copied across as a Scottish number. A Scottish figure depends on how Scotland’s sectors compare with the UK average, and that is what Scottish Government analysis, Scottish Fiscal Commission reports and Fraser of Allander Institute research are built to test.
The UK-wide result still sets a useful frame. Investment fell by more than output, and employment and productivity each fell by less. A Scottish analysis showing a much smaller fall in investment than the UK pattern would need a clear sector-based explanation. One showing a much larger fall in employment would need the same.
How forecasts have changed
The paper reports that contemporary forecasts were accurate over a 5-year horizon but underestimated the impact over a decade. For Scotland, this is the most practical lesson on forecasting. Early Scottish projections made soon after the referendum are most reliable for the shorter run, and a decade-long judgement should be treated as more likely to understate the cumulative loss than to overstate it.
Anyone comparing a Scotland Brexit economic forecast from an earlier period with later outcomes should therefore separate the horizon from the model. A forecast can be right about the first years and still too optimistic about the long run, because the mechanisms above compound gradually. A revised forecast that deepens the long-run estimate is consistent with this UK-level pattern, not necessarily evidence of an earlier error.
Scottish industries and where the mechanisms bite
Scotland’s economy has distinctive sectors, and the mechanisms set out in the study give a way to judge each one. The study itself is UK-wide, so the points below are tests to apply, not measured Scottish results.
Seafood and harbour trade
Fishing and seafood are among the sectors most often named in Scottish debates about trade. The test is whether firms in this sector report weaker demand or heavy management time spent on new arrangements, two of the four mechanisms. Where they do, the UK-wide pattern of gradual accumulation is the better guide, not a one-off adjustment.
Farming and rural trade
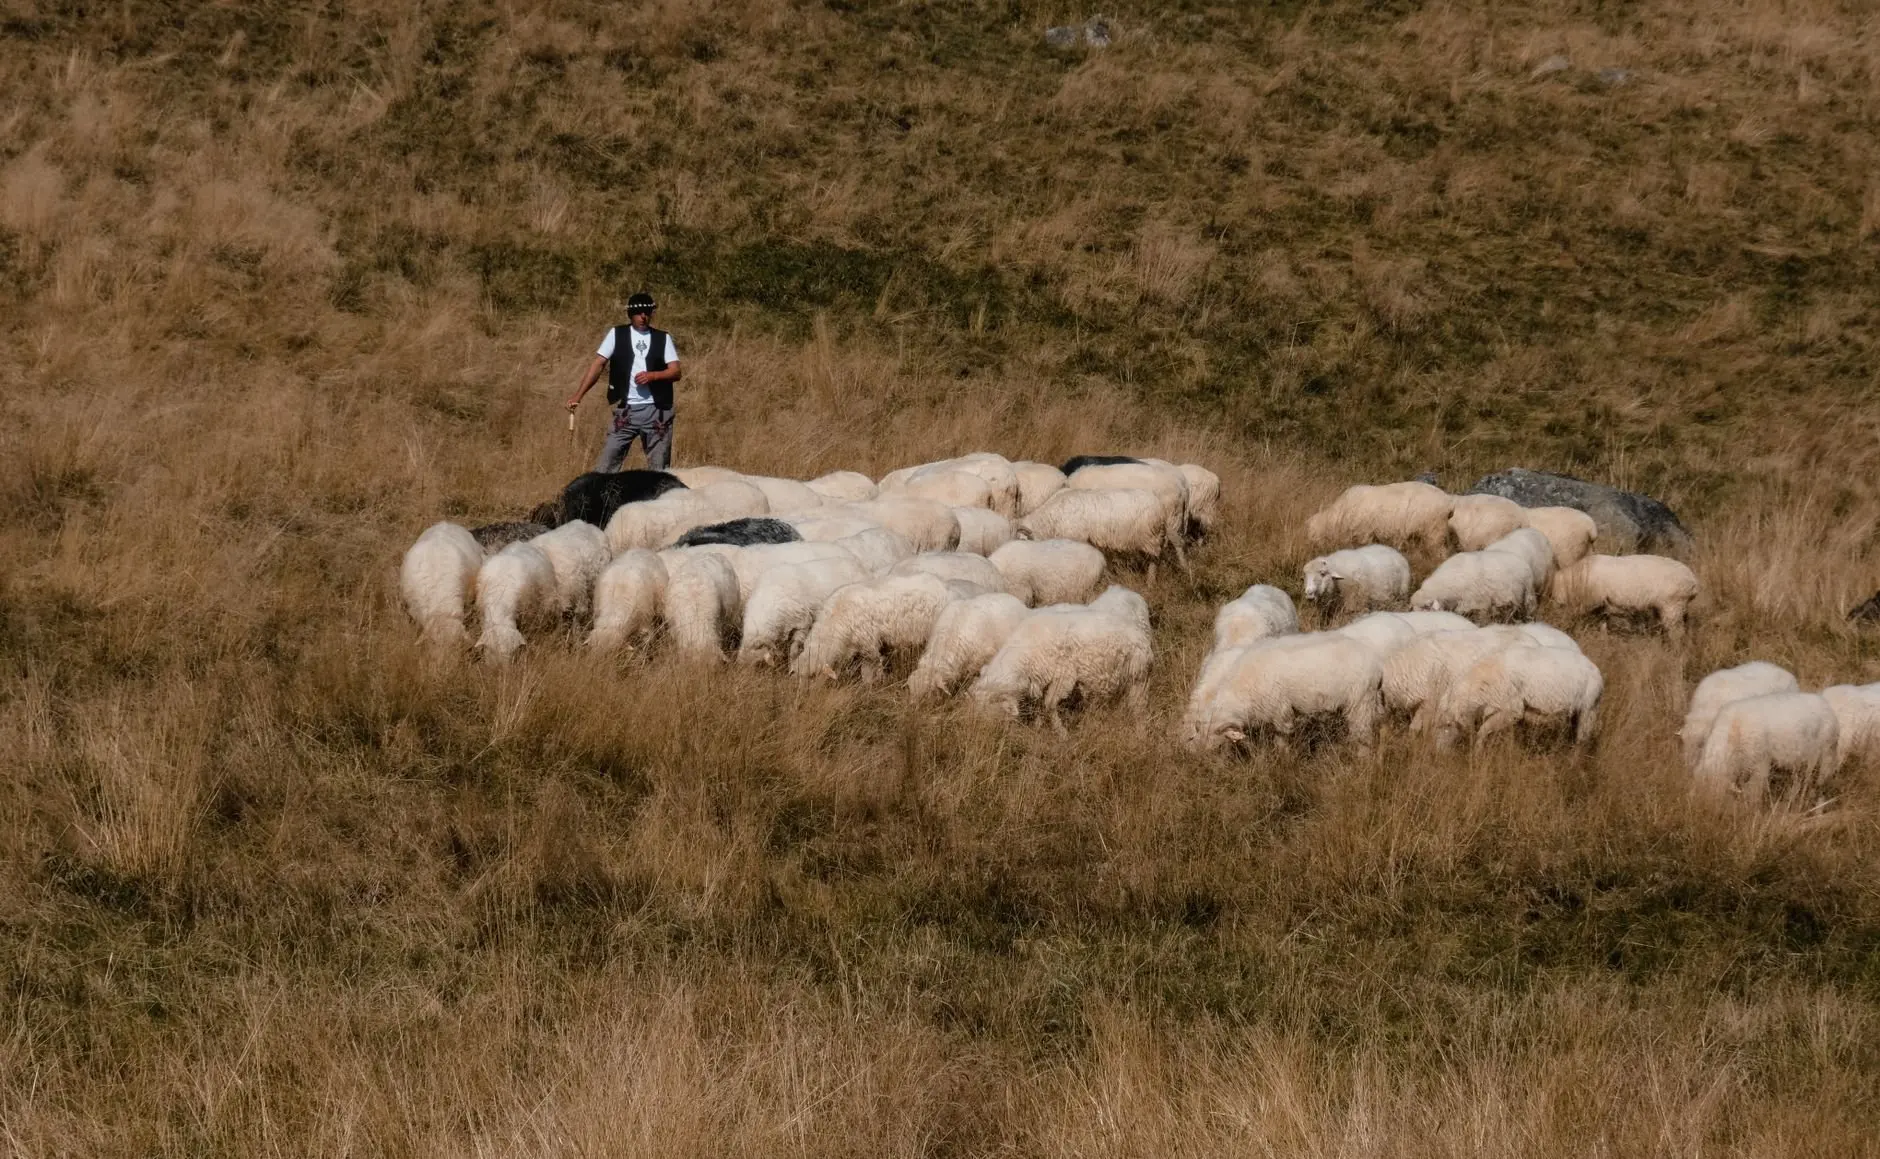
Sheep and other livestock farming in the Highlands and elsewhere depends on stable access to customers and inputs. Uncertainty is the mechanism to watch here, because farm businesses plan over long cycles. The study’s finding that investment fell most sharply points to deferred upgrades and expansion as the likeliest channel, though a Scottish farm-level estimate would need Scottish data.
Whisky and other exports
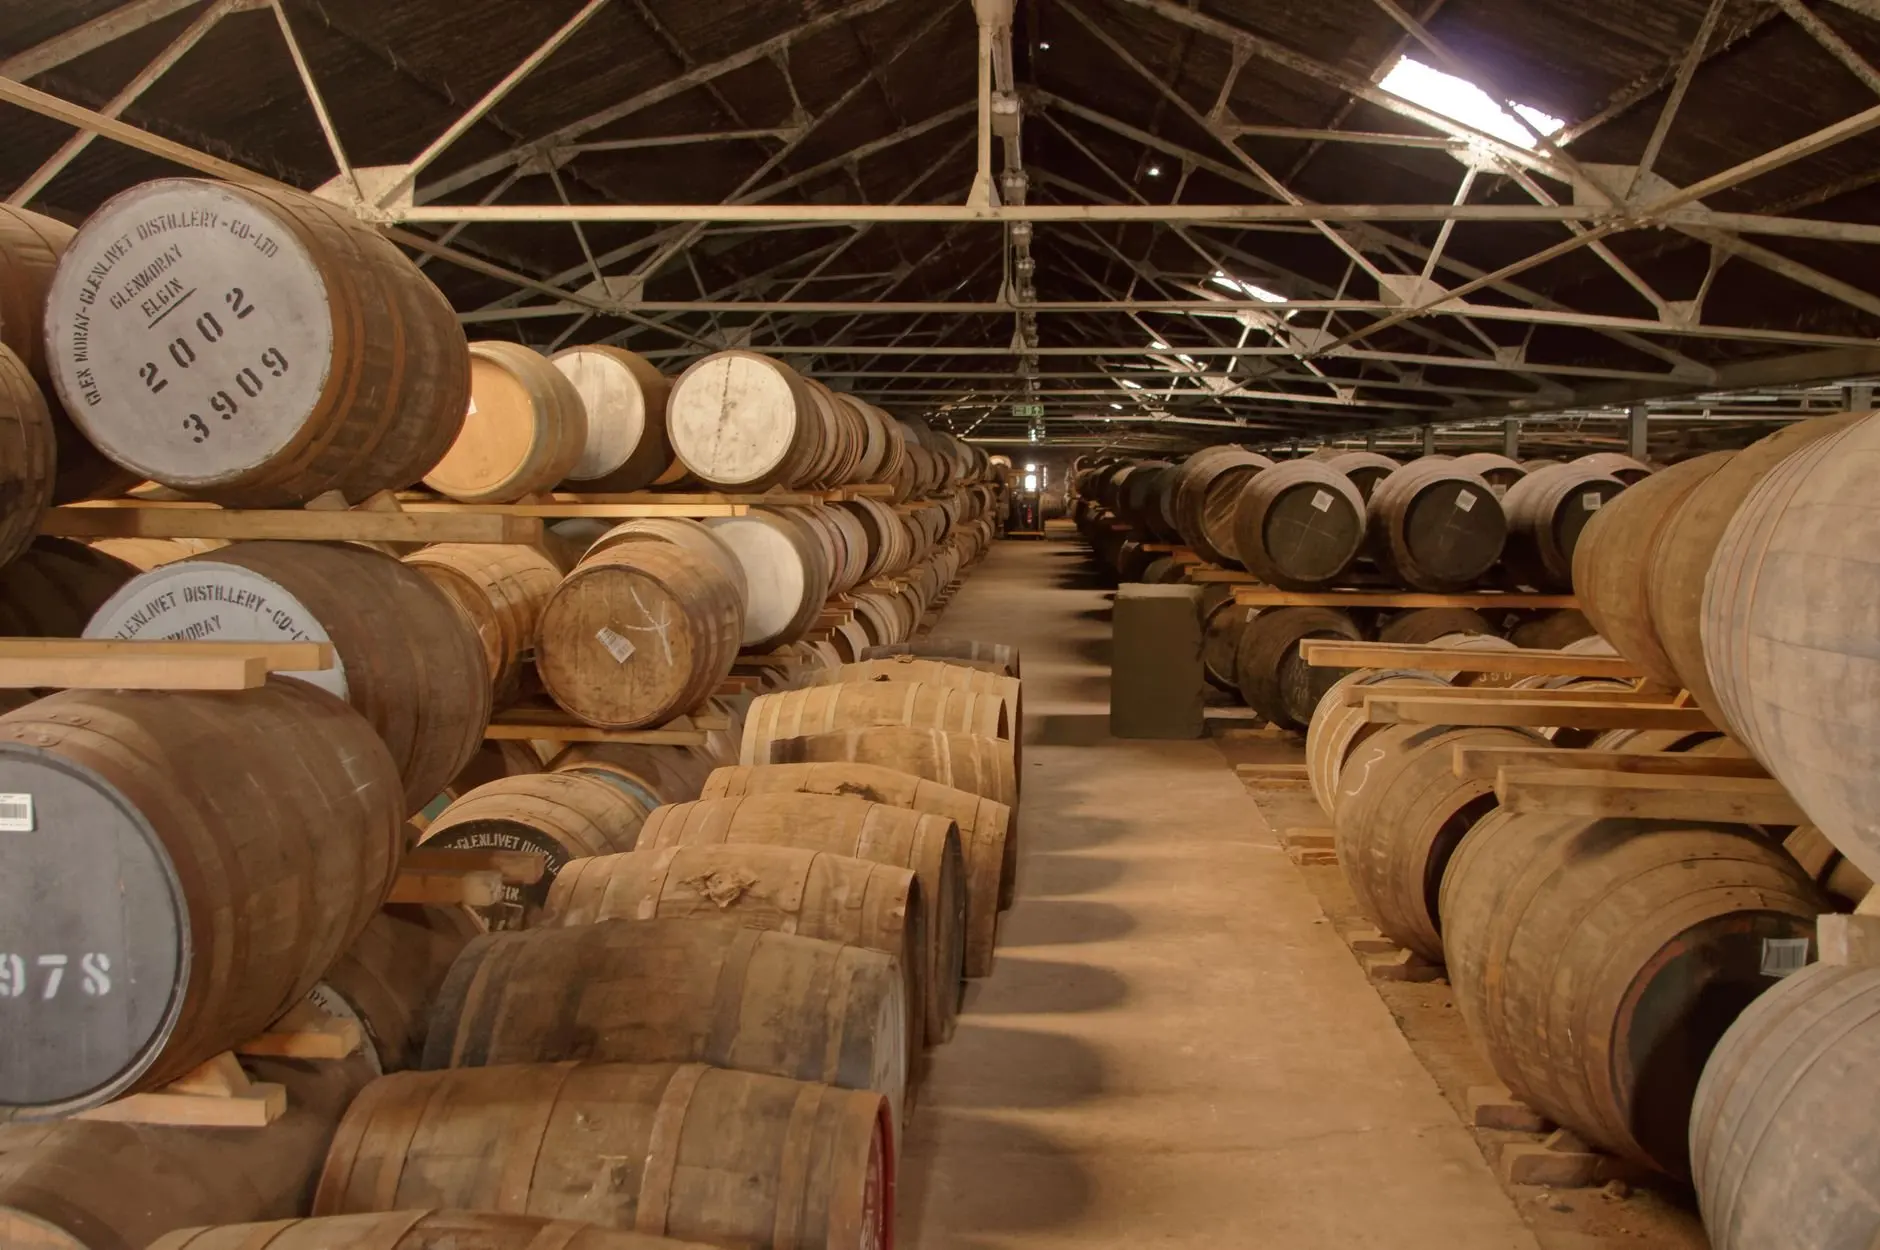
Whisky is a long-cycle product, since casks mature for years in warehouses before sale. That makes investment decisions and demand expectations especially sensitive to trading uncertainty. The UK-wide investment estimate is the figure most relevant to judging whether such long-horizon commitments have been held back.
Services and the labour market
Services employ most people in Scottish cities, so the employment and productivity estimates matter most here. A fall of 3% to 4% in each, at UK level, is a benchmark for judging claims about Glasgow, Edinburgh and other centres. Labour supply also depends on migration policy, which is covered in how did brexit change uk immigration rules.

Reading Scottish analysis well
Scottish Government analysis, independent Scottish forecasts and Fraser of Allander Institute research each answer a slightly different question, so the choice of source should follow the question. Three checks make any Scottish estimate easier to judge.
- Geography. Check whether a figure is Scotland-specific or a UK-wide result applied to Scotland. The SIEPR figures above are the second kind.
- Horizon. Check the period covered. Given the 5-year accuracy and decade-long underestimate, a short-horizon figure is not a safe guide to long-run cumulative loss.
- Mechanism. Check whether the analysis explains the loss through uncertainty, demand, management time or misallocation. An estimate that names a mechanism can be tested against sector evidence, and one that does not is harder to trust.
Used this way, the UK-wide benchmark and Scottish sector data complement each other. The first gives the scale, and the second shows which Scottish industries sit above or below it.
Frequently asked questions
How much did Brexit reduce UK GDP?
The SIEPR working paper estimates a reduction of 6% to 8% by 2025, accumulating gradually. This is a UK-wide figure, not a Scotland-only one.
Has Brexit hurt investment or employment more?
Investment, with an estimated fall of 12% to 18%. Employment and productivity each fell by an estimated 3% to 4%, on the same UK-wide basis.
How accurate were early Brexit forecasts?
The study found they were accurate over a 5-year horizon but underestimated the impact over a decade. Longer-run forecasts have been more likely to understate the loss.
Why does Brexit reduce growth beyond trade barriers?
The paper attributes the effects to elevated uncertainty, reduced demand, diverted management time and increased misallocation of resources. These act on firms in every sector, including Scottish ones.