

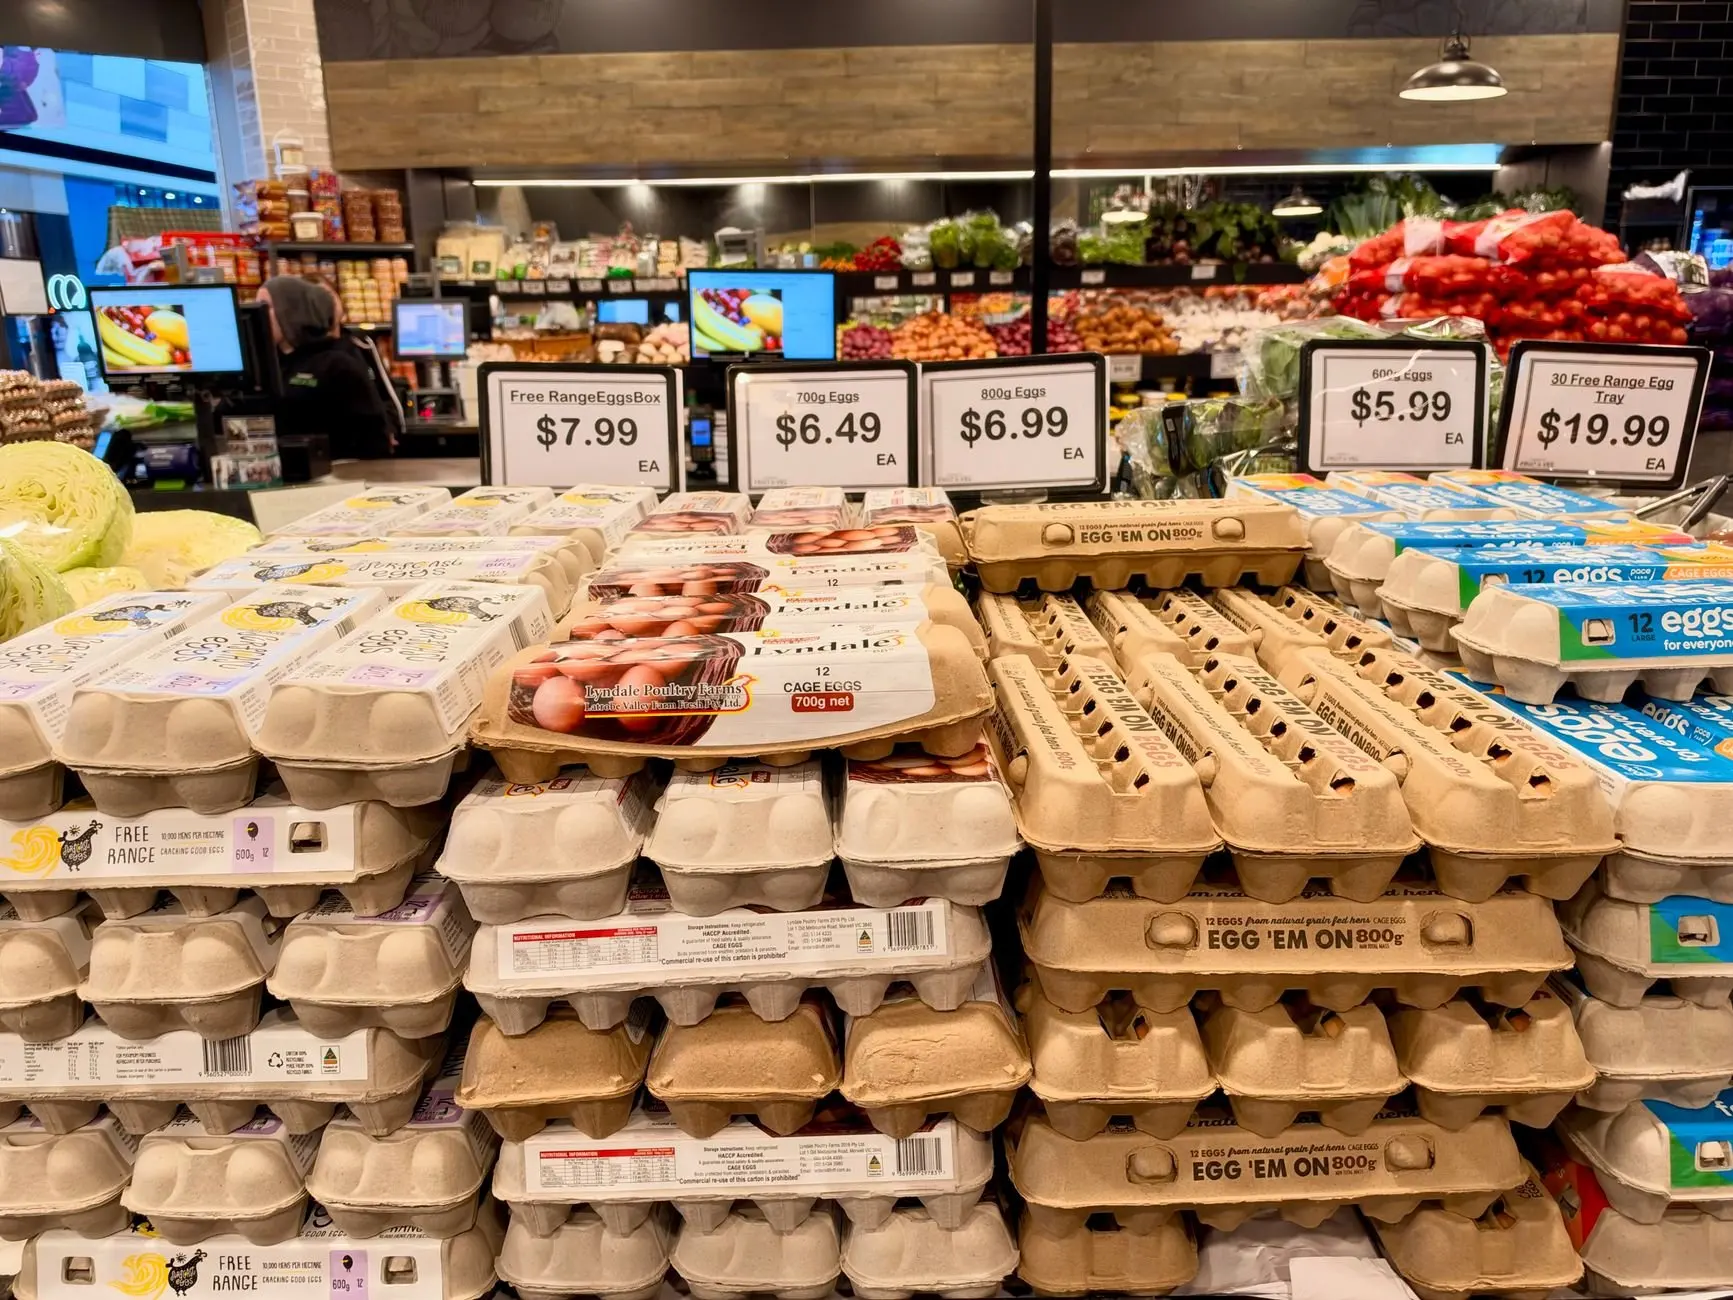
Has Brexit increased food prices UK shoppers pay? Partly. A weaker pound and extra trade paperwork added pressure, but weather abroad and a supermarket price war that had held costs down also moved shelf prices, so Brexit is one driver among several.
A shopper sees iceberg lettuce suddenly costing far more, and blames Brexit. The picture is more mixed than that. The wider economic impact of Brexit reaches shops through currency, trade costs and policy uncertainty, and each works differently from the weather and pricing effects that sit alongside it.
Common misunderstandings about Brexit and shop prices
Brexit shows up in shop prices through a few separate routes, and each belief about it is partly right and partly overstated. The table sets the usual assumptions against what the evidence supports.
| Common assumption | What the evidence supports | Planning use |
|---|---|---|
| Food inflation jumped because of Brexit alone | UK consumer price inflation rose to 2.3% in February 2017 from 1.8% in January, with food and fuel the largest contributors. A supermarket price war had previously kept costs down, and bad weather in southern Europe hit crops. | Treat any single-cause explanation of a monthly jump with caution. |
| A big jump in one product proves a trade effect | Iceberg lettuce rose 67.2% between January and February 2017, in a month when vegetable supplies were disrupted by weather. | Check for a weather or harvest explanation before crediting trade rules. |
| Brexit costs only appear as tariffs | Leaving the single market raised the paperwork and administrative costs of importing and exporting. | Look for cost pressure in compliance and handling, not only in duties. |
| A GDP estimate tells you the food price effect | One estimate puts the reduction in UK GDP at 6% to 8% by 2025. That is an output figure, not a shelf-price figure. | Use GDP estimates as context, not as a basket price. |
The inflation, food and weather figures come from a report on the early-2017 rise in the cost of living, and the paperwork and GDP findings from Econofact’s analysis of Brexit’s economic costs.
Three habits help when reading headlines about food prices:
- Separate the month from the trend. A single month’s jump in one product says little about a lasting effect.
- Ask what else changed. Weather, retailer pricing strategy and currency can all move at the same time as trade rules.
- Match the measure to the claim. GDP, headline inflation and a single product price answer different questions.
Sterling and the cost of imported food
The fall in sterling after the referendum is the clearest early link between Brexit and food prices. The report on UK inflation ties the rise in the consumer price inflation rate, from 1.8% in January 2017 to 2.3% in February, to sterling’s fall after the referendum, and names food and fuel as the largest contributors.
That route works through import costs. Retailers and wholesalers that buy produce and packaged goods from abroad face a higher bill in pounds when sterling is weaker, and some of that cost reaches the shelf. The same report notes that a supermarket price war had previously kept costs down, which helps explain why the pass-through became visible at the till when it did.

The practical lesson is about timing. A currency-driven rise tends to show first in goods that are bought abroad and sold quickly, such as fresh food, and it can fade or persist depending on where sterling moves next.
Trade paperwork and non-tariff barriers
Non-tariff barriers are the checks, forms and administrative steps that apply to trade even when no duty is charged. Econofact’s analysis finds that leaving the single market increased the paperwork and administrative costs of exporting and importing, and those costs fall on firms that bring food into the country.
Which food products were hit hardest by these barriers cannot be read off a single price, and the early-2017 evidence shows why. The sharp rise in iceberg lettuce prices came in a month when bad weather in southern Europe ravaged crops and left vegetables in short supply, so that jump is better explained by supply than by new rules. Paperwork costs are a steady addition to the price of getting a product across the border rather than a sudden shock to one item.
How these costs play out in goods flows more broadly is covered in the guide to how has brexit affected uk trade with the eu. For a shopper, the point is that paperwork is a cost of doing business that retailers may absorb, spread across products or pass on.
Supermarkets and the shelf price
Supermarkets sit between importers and households, and their pricing choices decide how much of an upstream cost shows up on the label. In early 2017 the largest price impact was in food and fuel, and the report notes that a supermarket price war had previously kept costs down. When retailers compete hard on price, they can hold prices through a cost shock for a time. When that pressure eases, accumulated costs appear more quickly.
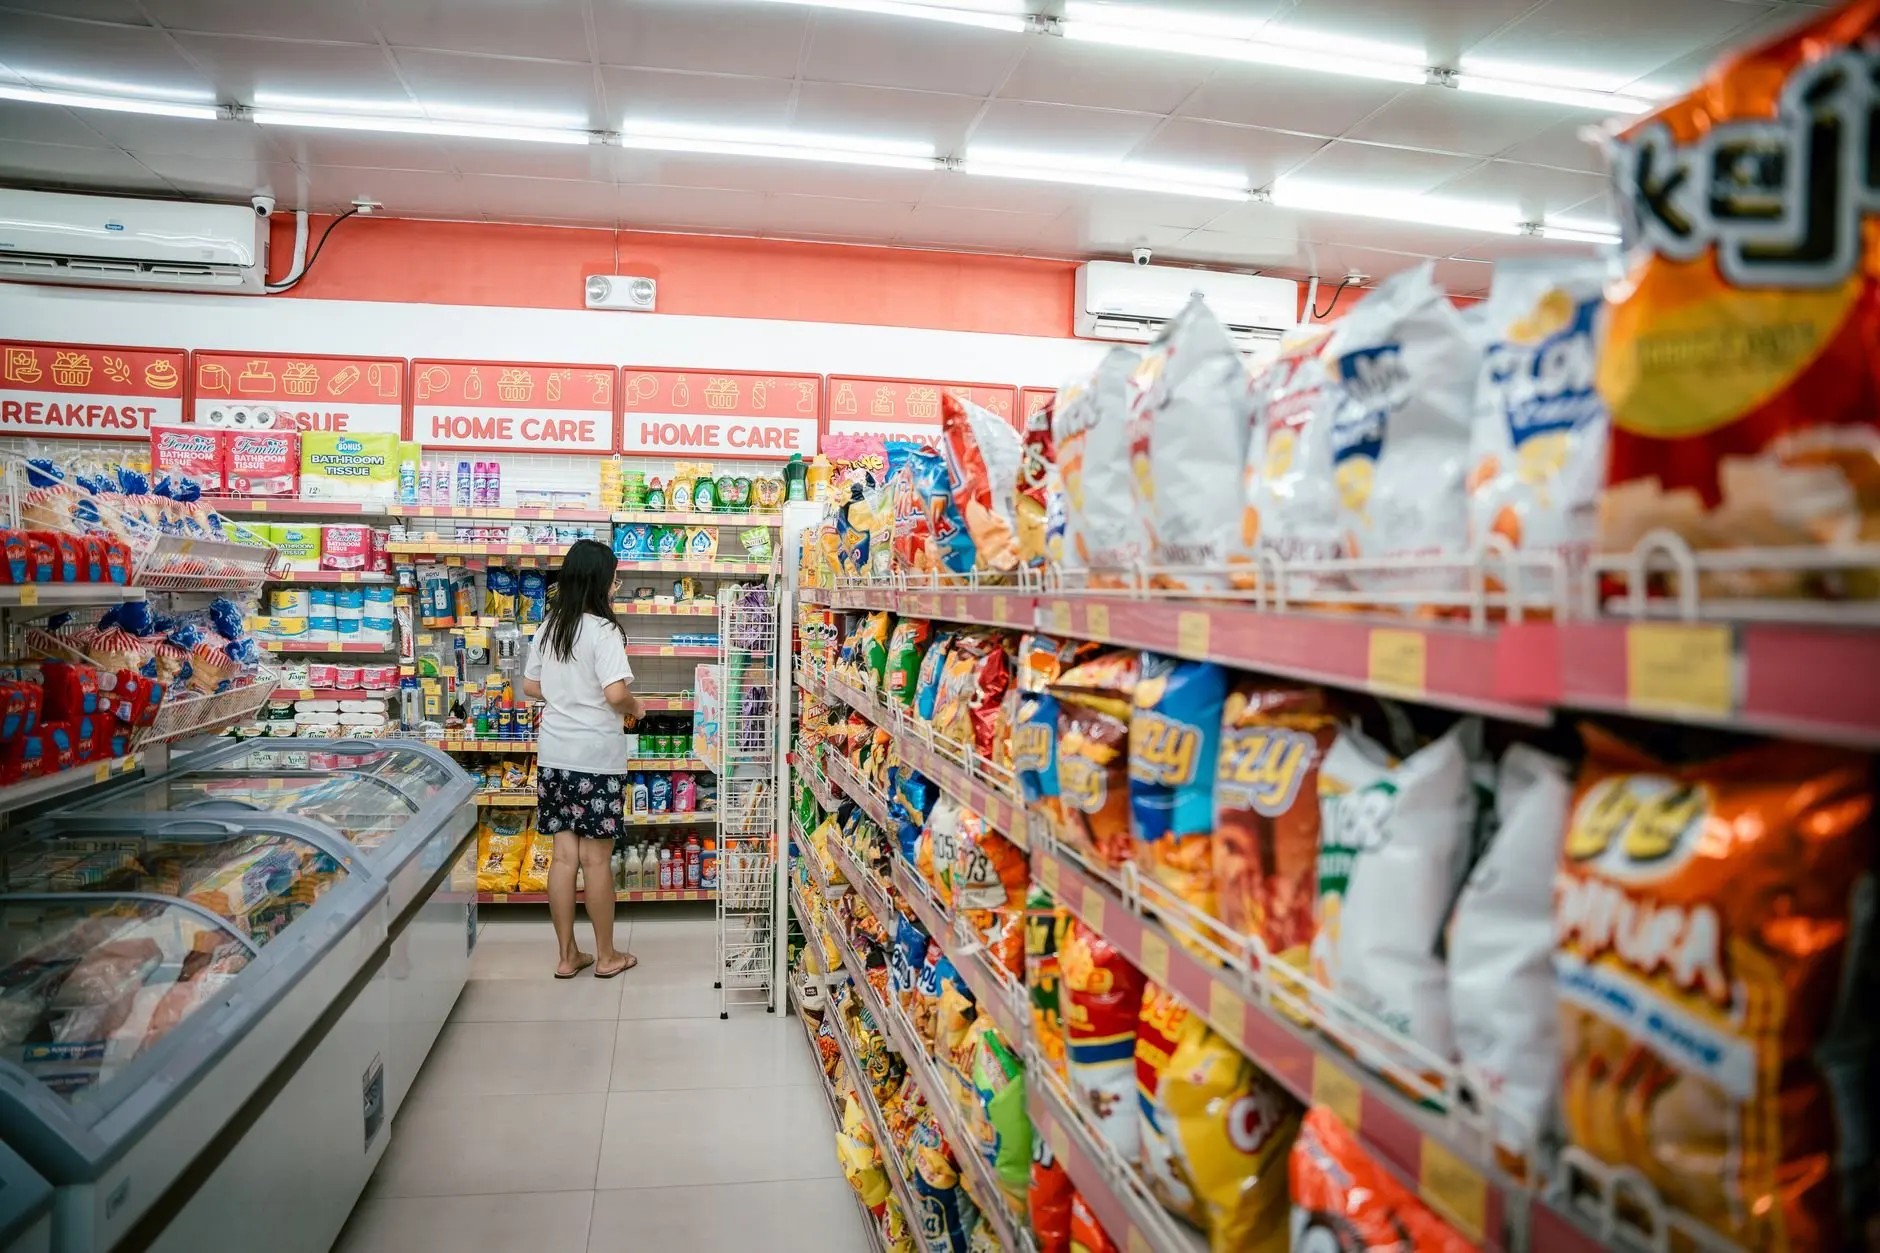
This is why shelf prices cannot be treated as a direct readout of Brexit. A rise at the till reflects import costs, retailer margins and competition together, and the share belonging to Brexit is only one part.
Brexit versus energy costs and the war in Ukraine
Energy costs and the war in Ukraine are separate pressures from Brexit, and the evidence on Brexit does not hand out a tidy percentage of food inflation to each cause. The best-supported quantitative finding in this area is an output estimate: Econofact estimates that by 2025 Brexit had reduced UK GDP by 6% to 8%. It also finds that prolonged policy uncertainty contributed importantly to the size of the impact.
Those findings describe the economy as a whole, so they should not be turned into a statement about food prices. The sensible reading is that Brexit weakened the economy and added trade friction, while other shocks pushed food costs up at the same time. Anyone claiming an exact Brexit share of a particular year’s food inflation needs a study that isolates food prices and compares them with a fitting benchmark.
Reading the ONS food inflation series
The most direct public measure of what shoppers pay is the food and non-alcoholic beverages component of the ONS Consumer Price Index. It is more useful than the headline rate for this question, because the headline blends food with fuel, housing and services. In February 2017, for example, the headline rate rose to 2.3% from 1.8% and food and fuel were singled out as the biggest drivers, which shows why the food component deserves its own look.
A few checks make the series more informative:
- Compare food with the headline rate. If food moves differently from the overall index, the cause is probably specific to food.
- Look for known supply events. Weather damage to crops can explain a spike in a product without any trade-policy cause.
- Compare periods, not months. Policy effects such as paperwork costs build gradually, while weather and currency swings can be abrupt.
Food prices also interact with the wider economy, including pay and employment. The guide to how has brexit affected the uk labour market covers the side of household budgets that sets how far higher shop prices are felt.
Frequently asked questions
| Question | Answer |
|---|---|
| Did food prices rise straight after the referendum? | Inflation rose to 2.3% in February 2017 from 1.8% in January as sterling fell, and food and fuel were the largest contributors, according to reporting on UK consumer prices. |
| Was the iceberg lettuce jump caused by Brexit? | The 67.2% rise between January and February 2017 came when bad weather in southern Europe damaged crops, so weather is the better-supported explanation. |
| Is the 6% to 8% GDP figure a food price estimate? | No. It is Econofact’s estimate of the reduction in UK GDP by 2025, and it comes with a finding that prolonged policy uncertainty added to the impact. |
| What extra cost did leaving the single market add? | Higher paperwork and administrative costs for importing and exporting, which apply to food entering the country. |